Key Summary
The private real estate market experienced a violent repricing between 2022 and 2024, driven by the most aggressive interest rate increases in a generation. For the first time since the mid-2000s, institutional allocators, family offices, and individual investors confronted a market where capitalization rates moved upward, borrowing costs spiked, and property valuations fell. The carnage was swift and unforgiving.
But by the second half of 2024, something changed. The market adapted. Cap rates stabilized. Lending standards loosened selectively. Property values began to rebound.

* Marcus & Millichap: “Will CRE Investors Adapt to Higher Rates?”
Now, as we look ahead to 2026, a new landscape is emerging, one defined not by uniform recovery but by bifurcation, where capital floods into consensus “safe” sectors like healthcare and datacenters while overlooking opportunities in selectively positioned multifamily strategies.
This white paper examines the macro forces reshaping private real estate and provides a guideline for investment strategy in 2026, drawing on data from PitchBook’s H1 2025 Global Real Estate Report (covering the first half of 2025), Marcus & Millichap’s the 2026 Multifamily Outlook, and operational insights from Peoples Capital Group, a vertically integrated multifamily operator with a 12-year track record in Northern New Jersey. The thesis is straightforward: institutional consensus creates blind spots, and for disciplined investors who understand the data, those blind spots represent alpha.
The analysis is structured for two audiences. For retail investors seeking diversification beyond volatile public markets, this paper provides a roadmap to understanding why real estate matters now and how to evaluate opportunities using institutional-grade intelligence. For institutional allocators, this paper offers a practitioner’s lens on translating PitchBook’s sector divergence data into actionable capital deployment strategy heading into 2026.
Key Conclusions
- The Interest Rate Shock Is Over, But the Bifurcation Has Just Begun. PitchBook’s 1-year horizon IRR for all private real estate was -0.1% in 2024, indicating that the market has largely stabilized after two years of valuation pressure. Longer-term horizons (5- and 10-year IRRs of 5.9% and 8.0%) reinforce that structural performance remains intact, even though near-term returns are still soft. Capital is concentrating in perceived safety, creating opportunity in overlooked segments.
- Multifamily Is the Middle Child of 2026. PitchBook data shows multifamily ranking mid-tier among real estate sub-asset classes, outperformed by healthcare, retail recovery, and datacenters but posting positive trends from 2023 to 2025 after negative performance in 2021-2023. Institutional allocators are following the data toward higher-performing headlines, but this broad-brush approach misses granular performance within the multifamily category itself.
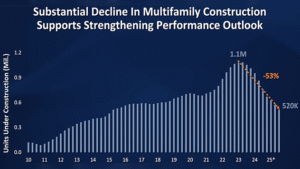
- The Supply Cliff Is Real and Structurally Driven. Multifamily construction peaked in 2023 and declined by approximately 53% from 2023 through 2025. This sharp contraction is not cyclical alone, but structural. Elevated construction costs, higher interest rates, constrained access to development financing, labor shortages tied to immigration policy, and tariffs on key building materials have materially impaired new project feasibility. The result is a growing future supply shortfall that will increasingly benefit existing assets in markets with durable demand.
- Regional and Operator Variance Matters More Than Ever. Not all multifamily markets are created equal. Northern New Jersey, with its 225,000-unit housing deficit, 95.2% occupancy rate, sub-1% new supply share, and 60-minute commute proximity to Manhattan, represents a fundamentally different risk-return profile than overbuilt Sunbelt metros experiencing 5-7% annual supply growth. Operator discipline, vertical integration, and localized expertise separate winners from losers.
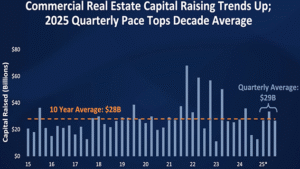
- Fundraising Is Recovering, But Cautiously. Real estate fundraising hit $67.3 billion in H1 2025, on pace to match or exceed 2024’s $109.1 billion total after two consecutive years of 25-30% YoY declines. Average time to close stretched to 28.7 months, the longest on record, signaling LP caution. Capital is flowing to established managers with proven track records through multiple cycles, not speculative operators.
- The Window Is Open, But Narrow. Supply constraints driven by higher construction costs, immigration crackdowns on labor, and tariffs on building materials have slowed new multifamily development. Existing properties in supply-constrained markets with strong fundamentals are positioned to benefit from reduced competition. This dynamic is time-sensitive and will shift as macro conditions evolve.
Key Quote
“The institutional playbook is built for safety, not for alpha. They chase the data everyone sees. The opportunity exists in what the data overlooks: the niche within the niche, the operator who executes when others hesitate, and the market where supply constraints create pricing power. That is where individual investors with flexibility and institutional allocators with discipline can outperform consensus.”
Introduction: The Market That Forgot How to Price
For nearly 15 years, private real estate operated in an environment so benign it barely resembled investing. Interest rates hovered near zero, borrowed capital flowed freely, and property valuations climbed on momentum more than fundamentals. Leverage was cheap. Risk was abstract. Returns were predictable. And then, in 2022, the game changed.
The Federal Reserve raised rates 11 times between March 2022 and July 2023, pushing the fed funds rate from near zero to over 5%. This represented the fastest tightening cycle in decades, fundamentally altering the economics of leveraged real estate.
Real estate, as a leveraged asset class dependent on borrowed capital and sensitive to cap rate movements, was hit hard. In the years leading into 2024, private real estate performance weakened meaningfully as higher borrowing costs worked through valuations. On a three-year horizon IRR basis (covering 2022–2024), core and core-plus funds delivered –1.2% annualized, while value-add strategies posted –1.7%, reflecting cumulative pressure from the rate reset.
By contrast, results in 2024 alone showed clear signs of stabilization. The asset class recorded a –0.1% one-year IRR—technically negative but functionally flat—indicating that the interest-rate shock is largely behind the market and that repricing is nearing completion. Preliminary Q1 2025 data showed core, value-add, and debt strategies working their way out of the negatives entirely. Green Street’s Commercial Property Return Index for North America posted six consecutive quarters of positive performance through Q2 2025. Property values, which had fallen sharply in 2022 and 2023, were no longer declining. They were stabilizing. In some markets, they were rising.
* PitchBook: 2025 Real Estate Report
The market, in short, had adapted. But adaptation does not mean uniformity. What emerged from the wreckage of 2023 was not a broad recovery but a bifurcated market, where capital flowed aggressively into perceived winners and abandoned everything else.
Part I: The Macro Context – What PitchBook’s and Marcus & Millichap’s Data Reveals for 2026
The Rate Environment: From Crisis to New Normal
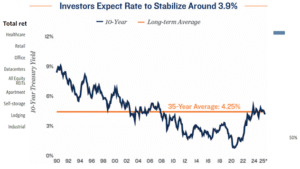
Interest rates remain elevated compared to the post-2008 era, but they are no longer rising. The Federal Reserve cut rates in September 2025 after a lengthy pause, signaling a shift in policy stance. Market-driven yields have been slower to follow. The US 10-year Treasury yield and 30-year fixed mortgage rates remain the highest since before the global financial crisis.
This creates a dual challenge for real estate. On one hand, the cost of capital is higher than at any point in the past 15 years, pressuring deal economics and forcing investors to underwrite more conservatively. On the other hand, the period of acute volatility appears to be over. Cap rates have stabilized. Lending standards, while tighter than during the zero-rate era, have loosened selectively for high-quality assets. The market has adjusted to the new baseline.
* Marcus & Millichap: “Investor Insights”, October 2025
For investors looking ahead to 2026, this means the repricing is complete. Properties purchased in 2020 and 2021 at peak valuations have already been marked down. New acquisitions in 2025 and 2026 will be underwritten at normalized cap rates, reflecting current borrowing costs. The question is no longer “when will the pain end?” but rather “where is the opportunity now?”
Sector Rotation: The Winners and the Forgotten
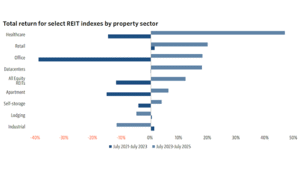
PitchBook’s H1 2025 analysis reveals a clear hierarchy among real estate sub-asset classes. Healthcare leads the pack, posting strong performance throughout 2023-2025 and benefiting from structural tailwinds including an aging population, inelastic demand for medical services, and favorable supply-demand dynamics in senior housing. Datacenters, buoyed by AI-driven infrastructure demand, have proven essentially immune to interest rate shocks. Retail, once left for dead, has recovered significantly, aided by the failure of weaker operators and the resilience of experiential and necessity-based retail formats. Office, despite continued challenges from remote work, has shown double-digit gains in the post-rate-shock period, driven by a bifurcation between trophy assets in gateway cities and everything else.
And then there is multifamily. According to PitchBook’s analysis, apartments rank mid-tier among sub-asset classes. Performance from 2023 to 2025 has been positive, recovering from negative territory in 2021-2023, but the recovery has been modest compared to healthcare and datacenters. Value-add multifamily posted a three-year horizon IRR of negative 1.7% as of December 2024, lagging behind opportunistic strategies at 0.7% and far behind distressed strategies at 5.6%.
This is the institutional view: multifamily is fine, not great. Healthcare is exciting. Datacenters are the future. Multifamily is consensus, commoditized, and crowded.
![]()
* Marcus & Millichap: “Capital Markets”, October 2025
But this view misses the nuance. Multifamily is not a monolith. A Class A luxury tower in Austin, Texas, where new supply is flooding the market at 7.3% of existing inventory, operates in a fundamentally different universe than a Class C value-add apartment complex in Paterson, New Jersey, where new supply represents 0.14% of inventory and demand is driven by proximity to Manhattan.
Institutional allocators, constrained by fund mandates and reporting structures, tend to invest at the sector level. They see “multifamily” as a single category and allocate accordingly. Individual investors and nimble family offices, by contrast, can go deeper. They can identify the sub-segment within the overlooked category and deploy capital where fundamentals, not consensus, drive returns.
This is the thesis: the opportunity in 2026 is not in chasing healthcare or datacenters alongside every other allocator. The opportunity is in understanding why multifamily is being overlooked and finding the specific strategies within multifamily that justify investment despite the broader narrative.
Part II: The Fundraising Environment – Capital Follows Safety, Not Alpha
The Slowest Market in a Generation
Fundraising for private real estate has been brutal. Capital raised fell 26.9% in 2023 and another 30.7% in 2024, the sharpest two-year decline since the global financial crisis. The average real estate fund took 28.7 months to close in 2025, nearly two and a half years, the longest timeline on record. Dry powder, the capital committed but not yet deployed, fell to $423.6 billion in 2024, down over $50 billion from 2023’s peak and the first year-over-year decline since 2012.
The reasons are straightforward. Performance was poor in 2023 and 2024, eroding LP confidence. Distributions, the lifeblood of capital recycling into new vintages, hit $105 billion in 2023, the lowest since 2012 despite the asset class having double the AUM. Negative net cash flows accelerated, meaning LPs were putting more capital into real estate than they were getting back.
In this environment, LPs became conservative. They stuck with established managers, those with proven track records through multiple cycles. Emerging managers, those with fewer than four funds, saw their share of total capital raised fall from a historical average of 26.9% between 2008 and 2022 to just 13.1% from 2023 through H1 2025.
At the same time, the development pipeline is contracting rapidly. Following a peak in multifamily construction starts in 2023, new development activity fell sharply through 2024 and 2025 as elevated construction costs, higher financing rates, tighter lending standards, labor shortages, and material tariffs rendered many projects uneconomic. This pullback is now creating a widening gap between structural housing demand and future supply. While current vacancy levels in certain markets still reflect deliveries from the prior development cycle, the absence of meaningful new starts is setting the stage for tightening conditions beginning in 2026 and beyond. As this supply shortfall materializes, existing multifamily assets in fundamentally sound markets are positioned to benefit from improving occupancy, rent stabilization, and reduced competitive pressure, creating a renewed opportunity set for disciplined investors.
* Marcus & Millichap: “The Forces Shaping the 2026 Multifamily Outlook”
But there are signs of recovery. Fundraising in H1 2025 hit $67.3 billion, putting the year on pace to match or exceed 2024’s total. Trailing 12-month figures suggest capital raised bottomed in Q4 2024 and has been climbing since. Fund closings are still slow, but they are happening. Capital is returning to the market, but it is selective capital, deployed cautiously and allocated to strategies with clear, defensible theses.
* Marcus & Millichap: “Four Reasons CRE Deal Flow Is Poised to Accelerate”
Where Capital Is Going in 2025 and Beyond
The largest funds raised in H1 2025 reveal LP preferences and what to expect heading into 2026. Blackstone Real Estate Debt Strategies V raised $8 billion, capitalizing on the shift toward private debt as banks retreat from commercial real estate lending. This trend is expected to continue into 2026.
Datacenters continue to dominate the thematic side. Principal Data Center Growth Income Fund raised $3.6 billion, and PGIM Real Estate Global Data Center Fund raised $2 billion. Both funds are betting on AI-driven infrastructure demand in the United States, a trend expected to accelerate in 2026.
Healthcare is also attracting capital, with strong performance metrics expected to drive continued allocation in 2026. The structural demand drivers, including an aging population and inelastic demand for medical services, show no signs of reversing.
Multifamily funds exist in this landscape, but they are not leading it. FPA Apartment Opportunity Fund IX raised $1.8 billion, ranking 10th among H1 2025’s largest closings, but even this fund is positioned as opportunistic, not core multifamily exposure.
The message is clear: capital is flowing to structural themes and to debt strategies offering predictable income in a higher-rate environment. Multifamily, as a category, is not commanding attention the way healthcare and datacenters are. And that is precisely why the opportunity exists for 2026.
Part III: The Overlooked Opportunity – Why Multifamily Deserves a Second Look
The Case for Multifamily: Fundamentals Over Hype
Multifamily real estate has a simple value proposition: people need a place to live. Unlike office, which can be rendered obsolete by remote work, or retail, which faces structural pressure from e-commerce, housing demand is inelastic. Recessions reduce discretionary spending, but they do not eliminate the need for shelter. In fact, during economic downturns, homeownership becomes less accessible, driving more people into rental housing.
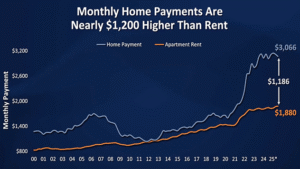
The fundamentals in 2026 support this thesis. Homeownership costs, including financing, have reached levels not seen since the mid-2000s. The average monthly mortgage payment for a new home in the United States exceeded $3,000 in 2024, while the average multifamily rent remained below $2,000. This affordability gap, which emerged sharply in 2022, persists today, creating sustained demand pressure for rental housing.
Demographically, trends favor multifamily. Millennials and Gen Z, now the dominant cohorts in the housing market, are delaying homeownership due to student debt, job mobility, and shifting lifestyle preferences. National homeownership rates have declined from 70.1% in 2004 to 62.9% in 2024, signaling a structural shift toward renting.

* – Marcus & Millichap: “The Forces Shaping the 2026 Multifamily Outlook”
Supply dynamics further strengthen the case. Higher construction costs, driven by inflation in labor and materials, have slowed new development. Immigration crackdowns have tightened labor markets in construction, extending project timelines and increasing costs. Tariffs on building materials, a byproduct of US trade policy, have added another layer of expense. All of these factors reduce new supply, creating pricing power for existing landlords in supply-constrained markets.
But here is the critical distinction: these dynamics are not uniform across all multifamily markets. Sunbelt metros like Austin, Charlotte, Nashville, and Phoenix are experiencing new supply growth of 5-7% annually, flooding markets with inventory and pressuring rents. Gateway cities like New York, San Francisco, and Los Angeles face different challenges, including regulatory constraints, high land costs, and weakening demand in some submarkets.
The opportunity for 2026 lies in markets that benefit from strong demand fundamentals, supply constraints, and operational inefficiencies that skilled operators can exploit.
The Northern New Jersey Thesis: A Case Study in Durable Fundamentals
Northern New Jersey is not a glamorous market. It does not appear on lists of the fastest-growing metros. It is not a tech hub. It does not attract headlines. But for investors who prioritize fundamentals over narrative, Northern New Jersey represents one of the most durable, recession-resistant multifamily markets in the United States.
The data tells the story. According to Berkadia’s Q1 2025 Multifamily Market Report, Northern New Jersey has 577,742 units of inventory, a 96.8% occupancy rate, and net absorption of 19,637 units over the trailing four quarters. New supply during the same period totaled just 16,838 units, meaning demand is outpacing supply. The region has a housing deficit of 225,000 units, a shortage that will take years to close even under aggressive development scenarios.
* – Marcus & Millichap: “The Forces Shaping the 2026 Multifamily Outlook”
Supply constraints are structural, not temporary. Zoning laws, environmental regulations, and community opposition to new development create high barriers to entry. Land costs in Northern New Jersey are elevated due to proximity to New York City, making new construction economically challenging. This protects existing landlords from oversupply risk.
Demand is driven by proximity to Manhattan. Northern New Jersey sits within a 60-minute commute radius of New York City, the largest employment center in the United States. This creates perpetual demand from workers priced out of Manhattan and Brooklyn who seek affordable housing with reasonable access to their jobs. According to Zillow Research and Federal Reserve data, the average monthly mortgage payment in New Jersey exceeds $3,000, while the average apartment rent is $2,747. This affordability gap has widened since early 2022, making renting not just preferable but necessary for a growing share of households.
Demographics further strengthen the thesis. Northern New Jersey is the third-most competitive rental market in the United States, according to Prudential’s 2025 report, ranking behind only Miami and Suburban Chicago. The region has 2,117,500 households and 1,288,300 employed residents, both growing at modest but steady rates. Lease renewal rates exceed 71%, indicating tenant satisfaction and reducing turnover costs for landlords.
This is not a speculative bet on future growth. This is a bet on durable, predictable demand in a supply-constrained market with structural barriers to entry. And within this market, the opportunity is not in Class A luxury developments competing for high-income renters. The opportunity is in Class B and Class C value-add properties where operational improvements, lease renegotiations, and unit renovations can drive rent growth and NOI expansion independent of broader market trends.
Part IV: The Operator Advantage – Why Execution Matters More Than Ever
The Vertical Integration Premium
In a bifurcated market where capital flows to consensus and overlooked opportunities require disciplined execution, operator quality becomes the primary differentiator. Multifamily investing is not passive. It requires active asset management, hands-on property management, and the ability to execute construction and renovation work on time and on budget.
This is where vertical integration matters. Most multifamily sponsors rely on third-party property managers, general contractors, and leasing agents. This introduces principal-agent problems, where incentives are misaligned and execution suffers. Third-party managers optimize for their fees, not necessarily for investor returns. General contractors pad budgets and extend timelines. Leasing agents prioritize speed over tenant quality.
Vertically integrated operators, by contrast, control the entire value chain. They manage properties in-house, ensuring alignment between asset-level strategy and day-to-day operations. They have direct relationships with contractors, electricians, plumbers, and HVAC technicians, allowing them to execute renovations faster and cheaper than competitors. They control leasing, ensuring tenant quality and minimizing turnover.
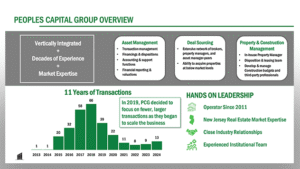
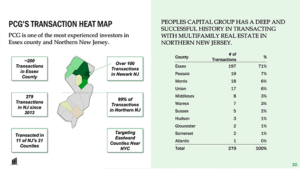
Peoples Capital Group exemplifies this model. Founded in 2013, PCG operates as a vertically integrated real estate investment firm focused exclusively on multifamily opportunities in Northern New Jersey. The firm has completed over 300 transactions, managing a portfolio of 191 units with a 99% occupancy rate. PCG manages properties through its in-house property management subsidiary, PCG Property Management LLC, and maintains direct relationships with eight general contractors, two plumbers, two electricians, and specialized HVAC and cabinetry teams.
This structure delivers measurable results. PCG’s historical average cash-on-cash return to limited partners on full-cycle investments is 15.1%, significantly above the 8-10% preferred return targeted at inception. The firm’s investor reinvestment rate is 83%, indicating LP satisfaction and confidence in the strategy. Average rent roll growth across currently held syndicated assets is 8.6% per year, driven by unit renovations, lease renegotiations, and operational improvements rather than market-wide rent increases.
Case Study: 196 9th Street, Passaic, New Jersey
The 196 9th Street property illustrates the value-add playbook in practice. PCG acquired the six-unit apartment building in June 2020 for $450,000, an off-market transaction negotiated directly with the seller at a below-market price. The property was Class C, poorly managed, and underperforming relative to its potential.
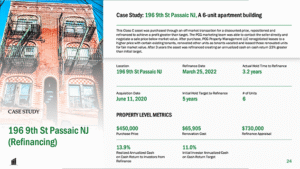
Over the next three years, PCG Property Management renegotiated leases with existing tenants, raising rents to market levels. As units turned over, PCG renovated them with updated kitchens, bathrooms, and flooring, then leased them at fair market value. Total renovation costs were $65,905, bringing the all-in basis to $516,000.
In March 2022, PCG refinanced the property at an appraised value of $730,000, a 41% increase in valuation over the purchase price. The refinancing generated a 13.9% annualized cash-on-cash return to investors, exceeding the initial 11% target. The property continued to perform above expectations, and in August 2024, PCG sold it for $990,000, a 92% increase over the purchase price and a 120% increase including renovation costs. The realized annualized cash-on-cash return over the full investment period was 11.7%, in line with initial targets despite a longer hold period than planned.
This is not a story of market-wide appreciation. This is a story of disciplined underwriting, skilled execution, and operator-driven value creation. The Passaic market did not double in value between 2020 and 2024. PCG identified a mispriced asset, executed a clear renovation and repositioning plan, and exited at a premium to intrinsic value.
Case Study: 463-465 Summer Street, Paterson, New Jersey
The 463-465 Summer Street property demonstrates the same principles at scale. PCG acquired the 11-unit mixed-use building in June 2020 for $965,000. The property was Class C, located in downtown Paterson, and suffering from deferred maintenance and poor management. Total renovation costs were $270,000, bringing the all-in basis to $1.235 million.
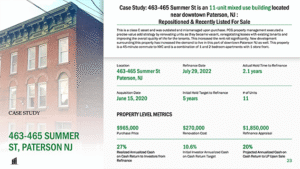
Over two years, PCG renovated units as they turned over, renegotiated leases with existing tenants, and improved common areas and building systems. New development in the surrounding area increased demand for housing in downtown Paterson, creating tailwinds for rent growth. In July 2022, PCG refinanced the property at an appraised value of $1.85 million, a 50% increase over the all-in basis. The refinancing generated a 27% annualized cash-on-cash return to investors, more than double the initial 10.6% target.
The property is currently listed for sale with an expected exit that will exceed initial investor return projections. Again, this is not passive beta. This is active, operator-driven alpha.
Part V: The Institutional Case – Translating Data Into 2026 Capital Deployment
Why Institutional Allocators Should Care
Institutional allocators, whether family offices, endowments, or fund-of-funds, operate within constraints that individual investors do not face. They have mandate-driven exposure targets, reporting requirements, and fiduciary responsibilities that prioritize risk-adjusted returns and downside protection. In this context, chasing consensus seems rational. Healthcare and datacenters are performing well. Multifamily is middling. Why deviate?
The answer is alpha. Institutional portfolios that mirror consensus positioning will generate consensus returns, which in a zero-sum game means underperformance after fees. Alpha, by definition, requires deviation from consensus. It requires identifying opportunities that others overlook and deploying capital where fundamentals, not narrative, drive returns.
The PitchBook H1 2025 data provides the roadmap for 2026. Multifamily’s middling performance reflects aggregate sector dynamics: oversupply in Sunbelt markets, demand weakness in some gateway cities, and the lagged impact of interest rate shocks on refinancing and exit timelines. But within this aggregate performance, variance is enormous. Certain markets, certain operators, and certain strategies are outperforming significantly.
The institutional opportunity for 2026 is to identify those outliers and allocate capital accordingly. This requires moving beyond sector-level data and conducting granular due diligence on regional fundamentals, operator track records, and deal-level underwriting.
Due Diligence Framework: What to Look For
For institutional allocators evaluating multifamily opportunities heading into 2026, the following framework is essential:
- Regional Fundamentals: Evaluate supply-demand dynamics at the MSA and submarket level. Avoid markets with new supply exceeding 4% annually. Prioritize markets with structural barriers to new development, such as zoning constraints, high land costs, or regulatory complexity. Assess demographic trends, employment growth, and household formation rates.
- Operator Track Record:Verify historical performance through multiple market cycles. Request audited financials for prior funds. Interview LPs from previous vintages to assess satisfaction and reinvestment behavior. Evaluate the operator’s vertical integration capabilities, including in-house property management, construction oversight, and leasing operations.
- Deal-Level Underwriting:Stress-test pro formas under adverse scenarios, including rent growth stagnation, higher vacancy rates, and elevated operating expenses. Verify cap rate assumptions against recent comparable sales. Assess debt structure, including loan-to-value ratios, interest rate sensitivity, and refinancing risk.
- Alignment of Interests:Evaluate GP commitment, fee structure, and preferred return hurdles. Prioritize operators with significant personal capital invested alongside LPs. Avoid fee-heavy structures where the GP profits regardless of LP returns.
- Exit Strategy:Assess the operator’s exit track record, including average hold periods, sale multiples, and realized IRRs. Understand the buyer universe for the asset type and submarket. Verify that the operator has relationships with institutional buyers, private equity firms, and other potential acquirers.
This framework separates disciplined allocators from consensus followers. It requires work. It requires skepticism. But it also generates alpha.
Part VI: The Retail Case – How Individual Investors Can Compete in 2026
The Flexibility Advantage
Individual investors lack the scale of institutions, but they possess a critical advantage: flexibility. They are not constrained by mandate-driven allocation targets. They do not answer to investment committees. They can move capital quickly, deploy smaller check sizes, and access opportunities that institutions overlook.
This flexibility is particularly valuable in real estate, where smaller deals often offer better risk-adjusted returns than larger ones. A $5 million multifamily acquisition in Northern New Jersey can generate 15% cash-on-cash returns because it is too small for Blackstone or Brookfield to consider but large enough to benefit from professional management and value-add execution.

Individual investors also benefit from speed. Institutional capital moves slowly, constrained by due diligence processes, legal reviews, and committee approvals. Individual investors can move in days or weeks, not months. In competitive markets, this speed translates into access.
Practical Steps for Individual Investors Preparing for 2026
For individual investors seeking to deploy capital into multifamily real estate in 2026, the following steps are recommended:
- Educate Yourself: Understand the basics of real estate underwriting, including cap rates, NOI, debt service coverage ratios, and cash-on-cash returns. Familiarize yourself with the differences between core, value-add, and opportunistic strategies. Read PitchBook reports, industry research, and operator presentations.
- Define Your Investment Criteria:Determine your preferred risk-return profile, hold period, and liquidity needs. Decide whether you want passive exposure through funds or syndications, or active involvement through direct property ownership. Establish minimum return thresholds and maximum risk tolerances.
- Evaluate Operators: Vet sponsors rigorously. Request track records, audited financials, and references from prior investors. Interview the GP team to assess their expertise, integrity, and alignment. Prioritize operators with vertical integration, local market expertise, and demonstrated ability to execute through multiple cycles.
- Understand the Market:Study regional fundamentals for the target market. Analyze supply-demand dynamics, demographic trends, and employment growth. Visit properties in person if possible. Talk to local brokers, property managers, and other investors.
- Diversify:Avoid concentrating capital in a single deal or operator. Spread exposure across multiple markets, strategies, and sponsors. This reduces idiosyncratic risk and smooths returns over time.
- Monitor Performance:Require quarterly reporting, including financial statements, occupancy rates, rent rolls, and capital expenditures. Hold operators accountable for underperformance. Ask questions. Push back on unexpected expenses or delays.
Individual investors who follow this framework can generate institutional-quality returns without institutional-scale capital. The key is discipline, skepticism, and a willingness to do the work.
Conclusion: The Window Is Open for 2026, But Narrow
The private real estate market entering 2026 is bifurcated. Capital is flooding into consensus positions: healthcare, datacenters, debt strategies. Multifamily, once the darling of allocators, is being overlooked. Institutional dollars are moving elsewhere. Emerging managers are struggling to raise capital. The narrative has shifted.
But narratives and fundamentals often diverge. The data shows that multifamily, as an aggregate category, is performing modestly. But within that category, performance variance is enormous. Certain markets, certain strategies, and certain operators are generating returns that exceed healthcare and datacenters. The opportunity exists for investors who are willing to look past the headlines and focus on the details.
Northern New Jersey, with its structural housing deficit, supply constraints, proximity to Manhattan, and strong demographic fundamentals, represents one such opportunity for 2026. Operators like Peoples Capital Group, with vertical integration, local expertise, and a 12-year track record of disciplined execution, represent the type of partner that converts data into returns.

The window is open, but it is narrow. Supply constraints are temporary. Macro conditions will shift. The repricing that created opportunity in 2024 and 2025 will eventually normalize. The time to act is now, with discipline, with rigor, and with a clear understanding of what separates consensus from alpha.
The institutional playbook is built for safety. The individual investor’s playbook can be built for returns. And the difference between the two is understanding that data reveals what is happening, but only execution determines what happens next.
Next Steps: Join the Conversation
This white paper is designed as a companion to our upcoming webinar, Portfolio Diversification in 2026: How Multifamily Repricing and Selective Niche Performance Create New Paths for Investors. The webinar will feature:
- Nik Brodskiy, CEO of AltsCustodian, Professor of Finance at San José State University, and author of Beyond Wall Street: The Rise of Private Markets
- Aaron Fragnito, Co-Founder of Peoples Capital Group, with 12 years of operational experience and over 300 completed transactions
During the webinar, we will:
- Analyze PitchBook’s Real Estate Report and what it means for 2026 strategy, translating institutional data into actionable intelligence
- Present real case studies from PCG’s portfolio, including the 196 9th Street and 463-465 Summer Street properties
- Discuss the specific underwriting criteria PCG uses to identify and execute value-add opportunities
- Answer your questions about multifamily investing, regional fundamentals, and portfolio diversification
Whether you are an individual investor seeking to diversify beyond public markets or an institutional allocator evaluating real estate positioning for 2026, this webinar will provide clarity, context, and a path forward.
Disclaimer: This white paper is for informational and educational purposes only and does not constitute an offer to sell or a solicitation to purchase any securities. Any potential offering will be made solely through formal offering documents and in compliance with applicable securities regulations. Past performance does not guarantee future results. Prospective investors should conduct their own due diligence and consult with independent financial, legal, and tax advisors before making any investment decision. All data presented is sourced from PitchBook, Peoples Capital Group, and publicly available market research and is believed to be accurate as of the date of publication but is subject to change.